Getting Started with FinOps on Microsoft Azure
In the first of what I plan to be several posts on FinOps on Microsoft Azure, I wanted to use the first post to layout my plans for this mini series of posts.
- Getting Started with FinOps on Microsoft Azure (this post!)
- Ensuring Maximum Cost Visibility on Microsoft Azure
- Managing Budgets on Microsoft Azure
- Optimising Resources on Microsoft Azure
- Managing Resource Efficiency on Microsoft Azure
With that, let’s get started by looking at an introduction to FinOps and the tools available to us in Microsoft Azure.
What is FinOps?
There is no better place to start than quoting the definition of FinOps directly from the FinOps Foundation.
FinOps is an evolving cloud financial management discipline and cultural practice that enables organizations to get maximum business value by helping engineering, finance, technology and business teams to collaborate on data-driven spending decisions.
I am also a member of the FinOps Foundation community, as well as a FinOps Certified Practitioner, so what role does the FinOps Foundation also play?
Well, the foundation is itself a project as part of The Linux Foundation, just like the Cloud Native Computing Foundation. Through best practices, education, and the definition of standards, the FinOps Foundation’s mission is simply: To advance every individual who manages the value of cloud wherever they are.
Introducing the FinOps Framework
The FinOps Framework, defined by the FinOps Foundation sets out to provide the operating model for how to establish and excel in the field of FinOps.
At it’s core, the framework is made up of several domains, and those domains contain capabilities. Taken together, the FinOps Domains represent the Capabilities an organization must perform in the practice of FinOps. Every organization will leverage each Domain in their FinOps practice. The particular mix of capabilities implemented within each Domain may be unique for an organization and will depend on their FinOps maturity level.
Introduction to Azure Cost Management
Before you start looking at your usage in Azure Cost Management (ACM), it’s important to understand how the data in ACM is scoped. Scoping follows the standard pattern for Microsoft Azure. This means the following scopes are available:
- Management Groups
- Subscriptions
- Resource Groups
If you set the scope on the initial Overview page of ACM, any of the pages you visit on the blade will be scoped to what you select here.

The Cost Management tooling is only supported on a subset of Azure offers, you can check which ones are currently supported in the documentation.
Cost analysis
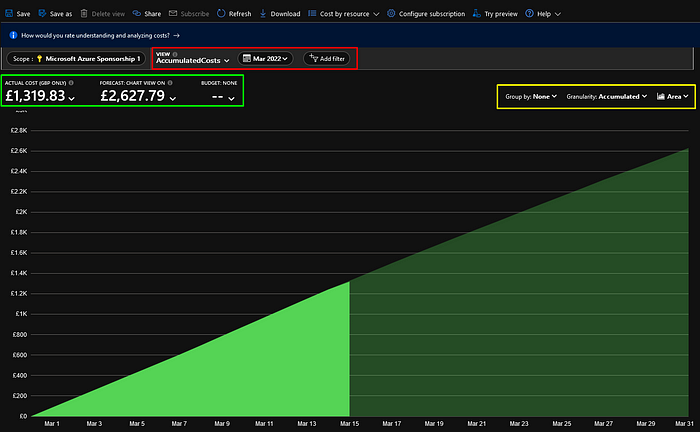
Let’s have a look first at the Cost analysis screen within ACM. This is where the bulk of your work will take place. I speak to a lot of people who are quite intimidated by what they see when opening this page. Before we look at things we can do, let’s have a look at the components on the screen, this will give us a better idea of how to use them.

Let’s start by looking at the area highlighted in red. This area provides two purposes, the first is to select one of the pre-defined views which are available to you (more on this later), the second is for filtering. Firstly, as you can see by date, then secondly, you can add custom filters for a number of things, we will use this shortly.
The date range allows you to specify a number of pre-defined ranges, such as the last 7 days, 30 days, month, quarter, or year. You can also specify your own custom range if required. Filtering allows you to specify a number of different search criteria based on the data you would like to retrieve.
The green area on the image shows us the actual cost consumed in the period we have specified, as well as the forecasted costs over that period. If you have a budget defined, then you can add the budget to the chart to visually see when your costs will intercept.
Lastly, the yellow area. This gives us grouping options, depending on what data is shown on the chart, options to change the granularity of the data shown, and finally, to select the type of chart you want to display. In the middle is obviously the data that is getting rendered on the chart.
Summary
This was designed to be a brief overview of FinOps in general, and some of the cost management capabilities within Microsoft Azure. In future posts, we will be looking at how to align several elements of the FinOps Framework to your cost management efforts in Azure.
